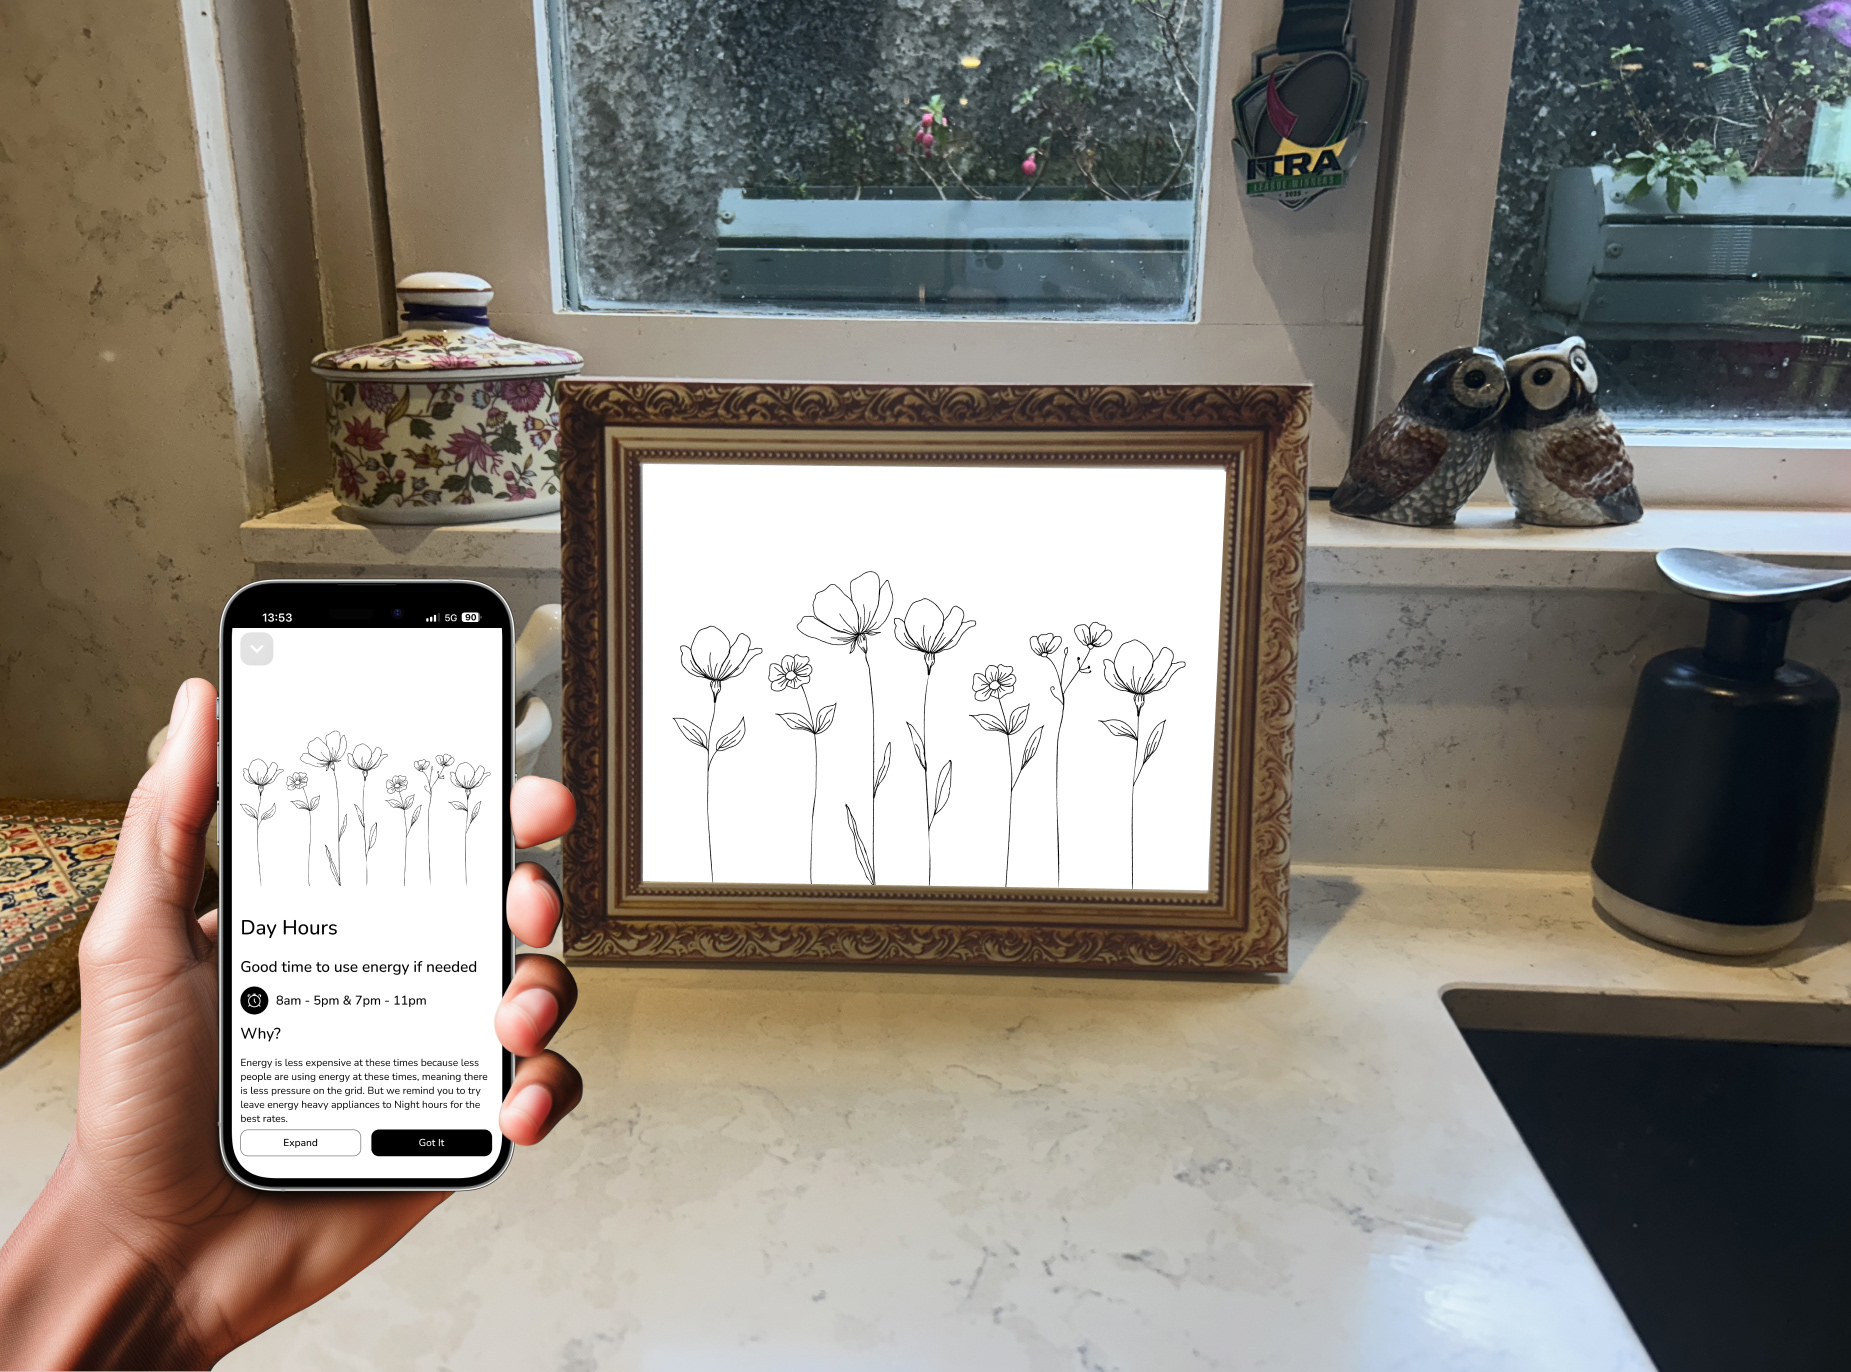
Energy Framer
An e-ink display that takes your smart meter data and turns it into a living, moving piece of art that fits into a domestic setting.
Project Brief
Reducing Energy Consumption in the Home.
Company: NCAD
Team: Individual
Role: Research, concepts, making, presenting
Time: 12 Weeks
Year: 2025

Research
I was in a research group with Evan Kenny.
Research Methods:
Interviews: Conducted 10 interviews.
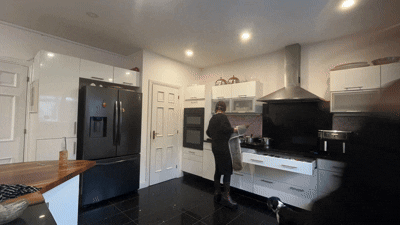
Observations: We set up time lapse studies in our homes, specifically the kitchen.
Cultural Probe: We got some of our interviewees to do cultural probes.
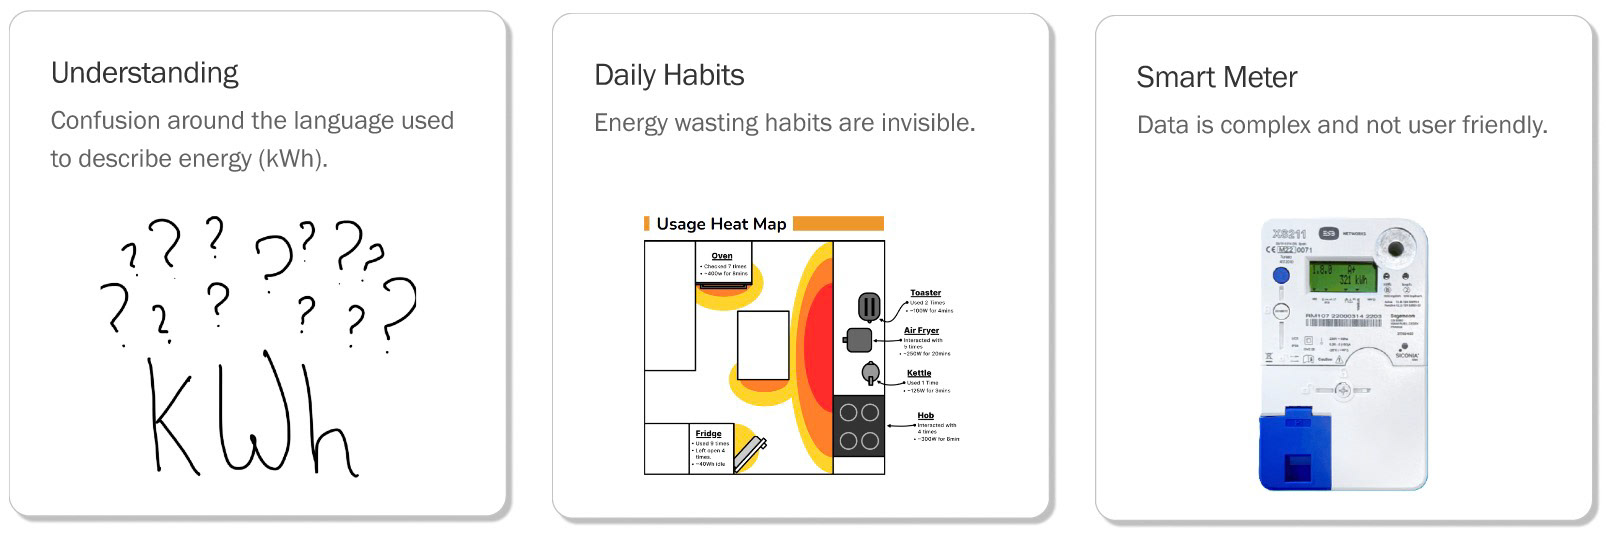
Secondary: Desktop research to get a better understanding of energy and what is currently being done.
Problem Space
Actionable Insights
Insight 1:
Without clear feedback, people don’t realise how habits waste energy.
Insight 2:
The delivery method of energy information changes user behaviour.
Insight 3:
The ease of modern appliances leads to thoughtless energy use and frequent waste.
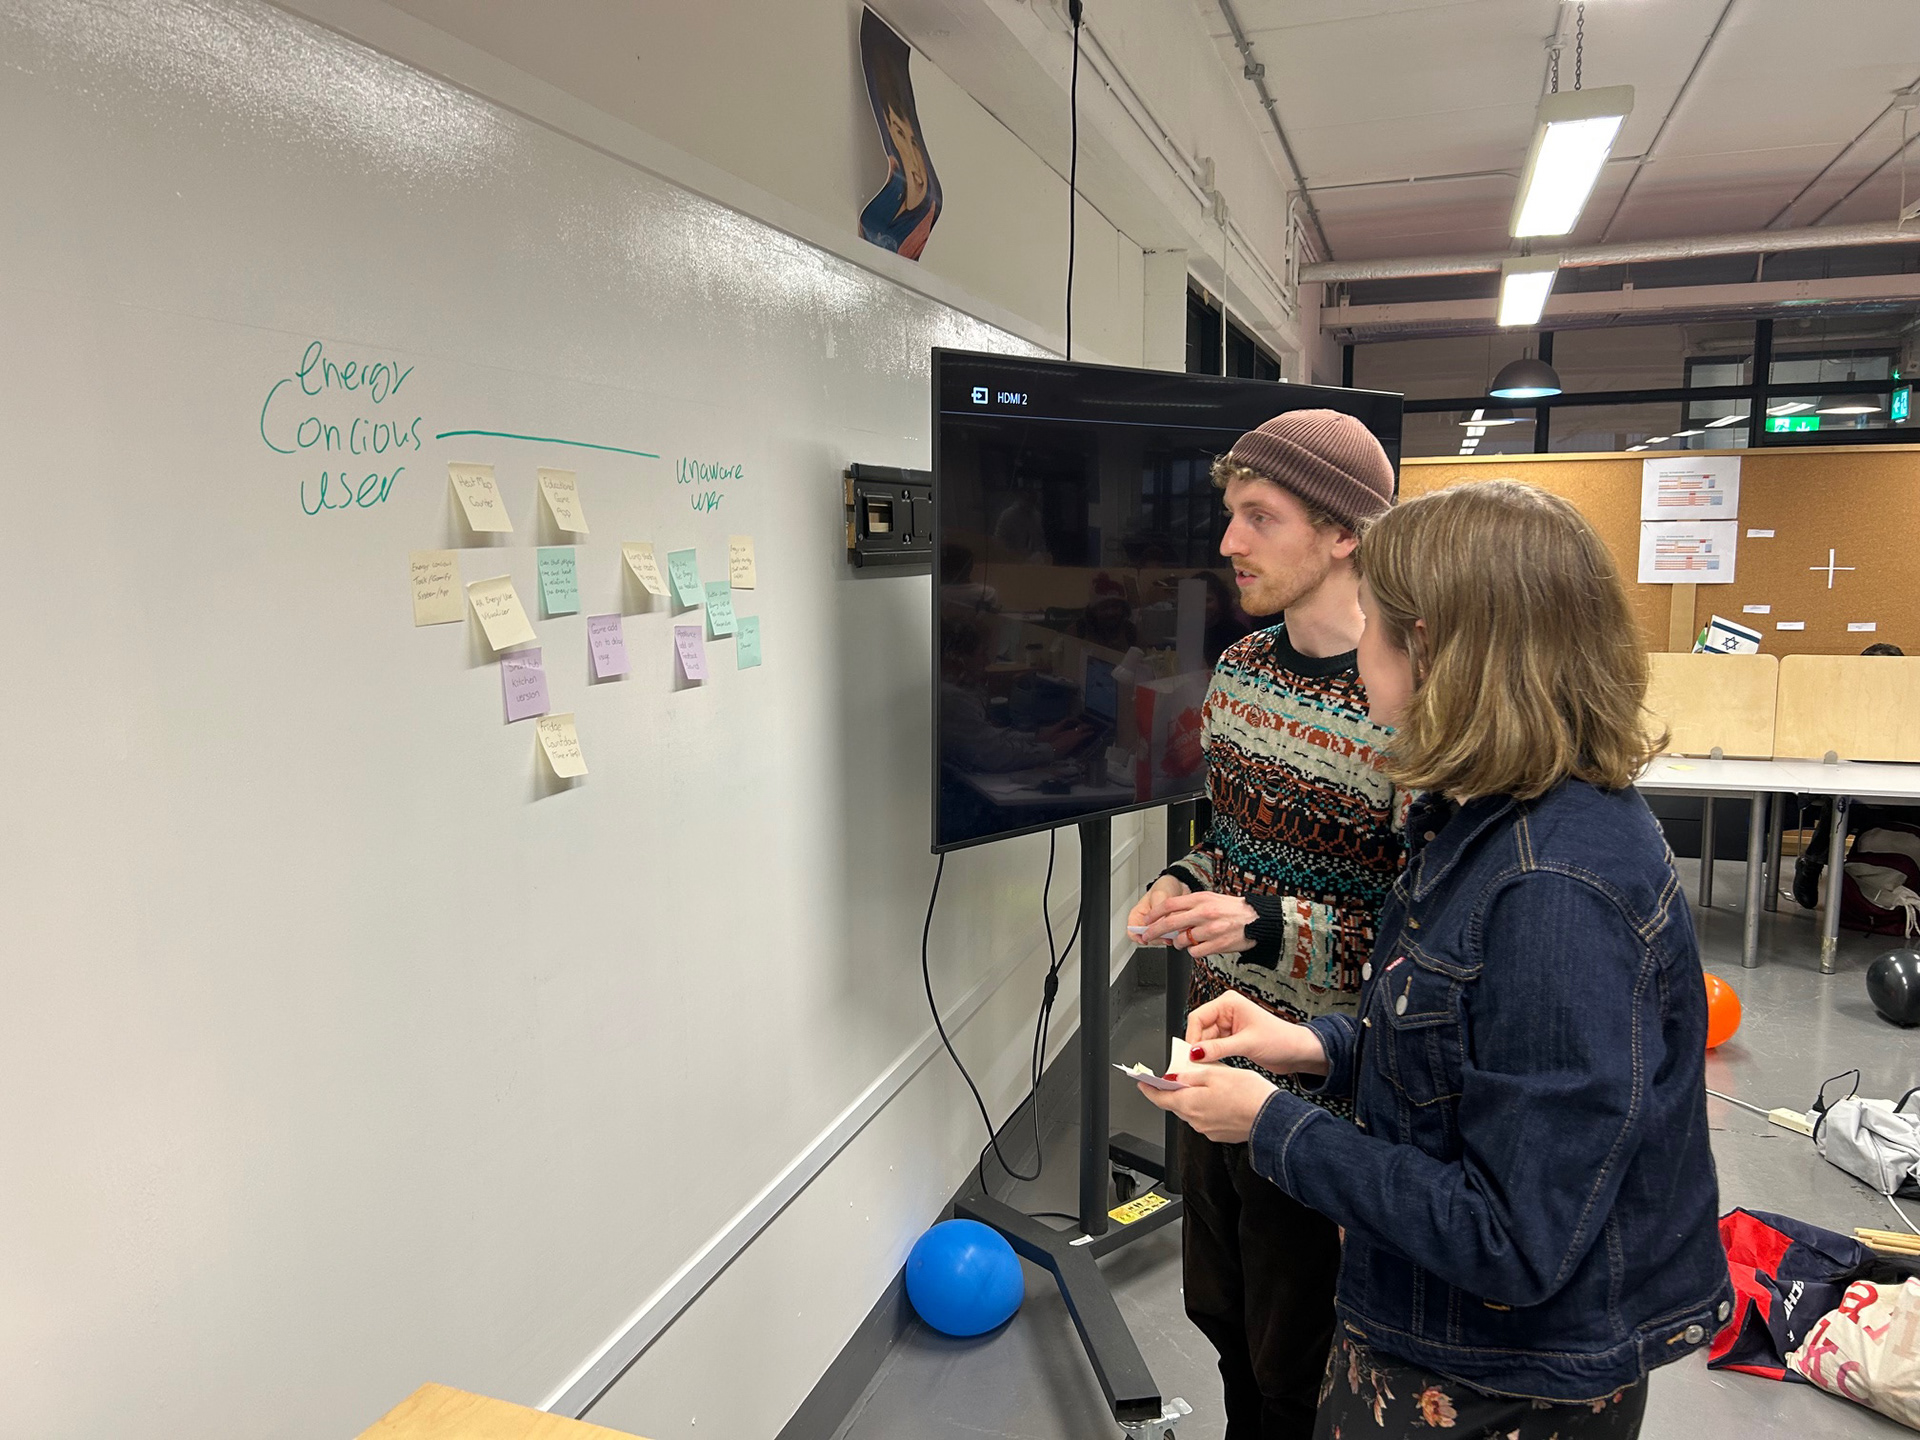
Concepts
Generated initial concepts through brainstorming activities, including Crazy Eights.
Some concept ideas were prototyped and user tested.
I moved forward with Energy Framer individually.
What is Energy Framer?
Takes energy data and turns it into a living, moving piece of art, bringing your energy to life in your home.
Invites curiosity around energy across households and generation through art.
Uses language that people understand (instead of kWh its explained in cost).
What is the value of Energy Framer?
Shift energy usage time
Empowers people to shift their energy use to outside peak hours, easing pressure on the grid.
Makes energy understandable
It creates visual data through art making it more accessible and understandable.
Gives households control
It gives households control through understanding energy consumption and peak times.
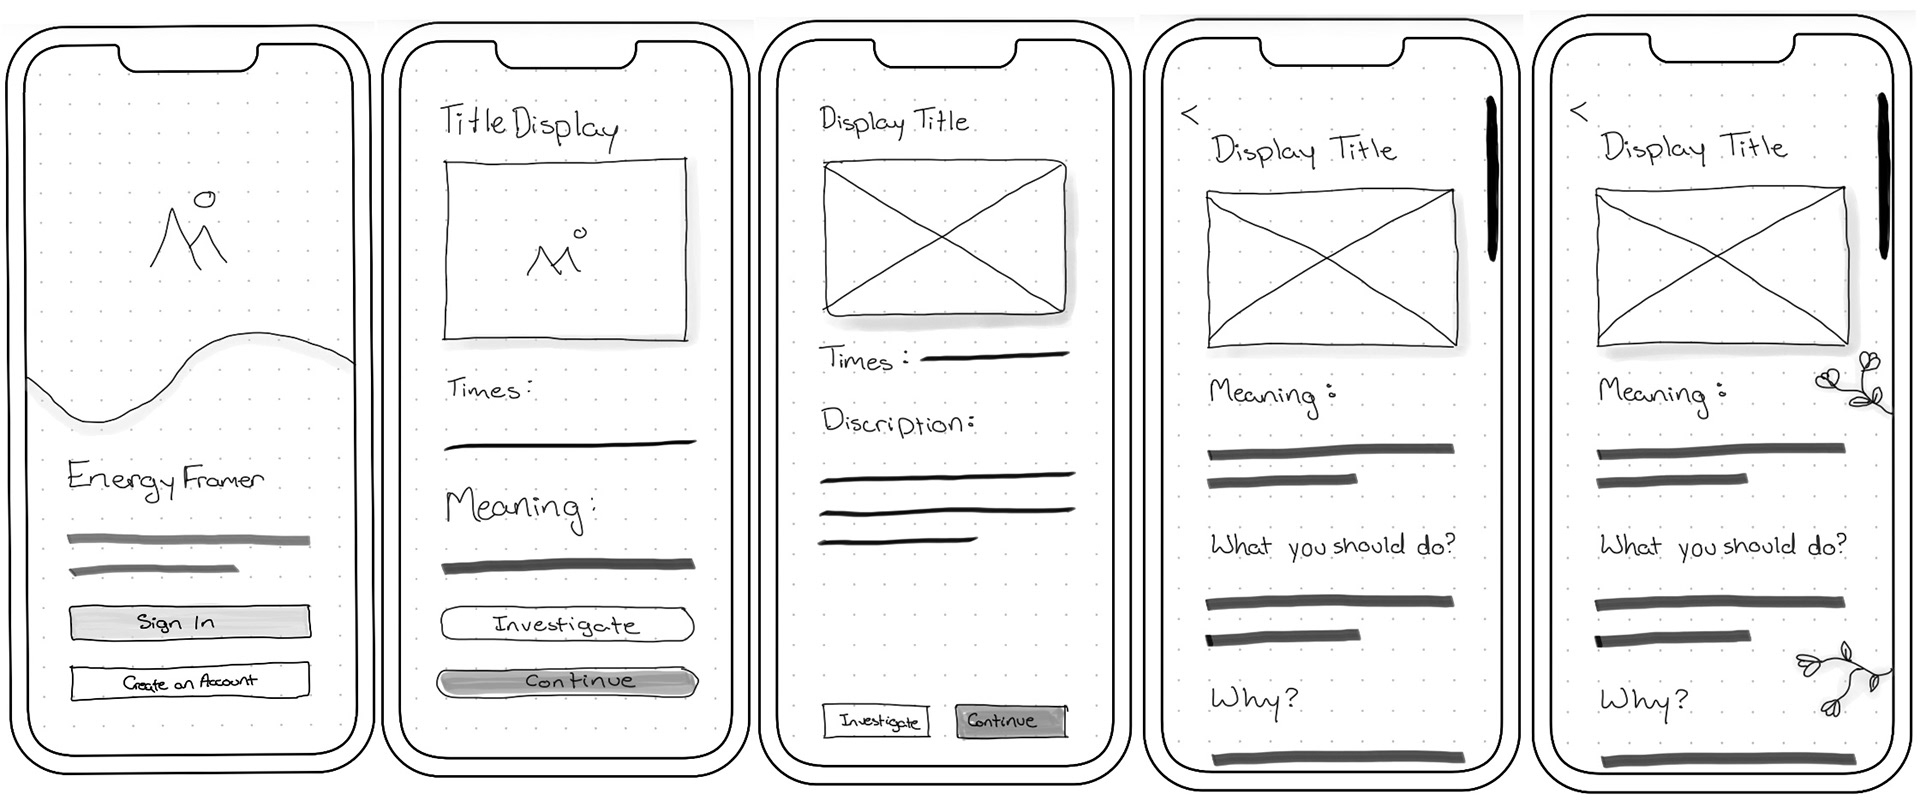
Prototype Development
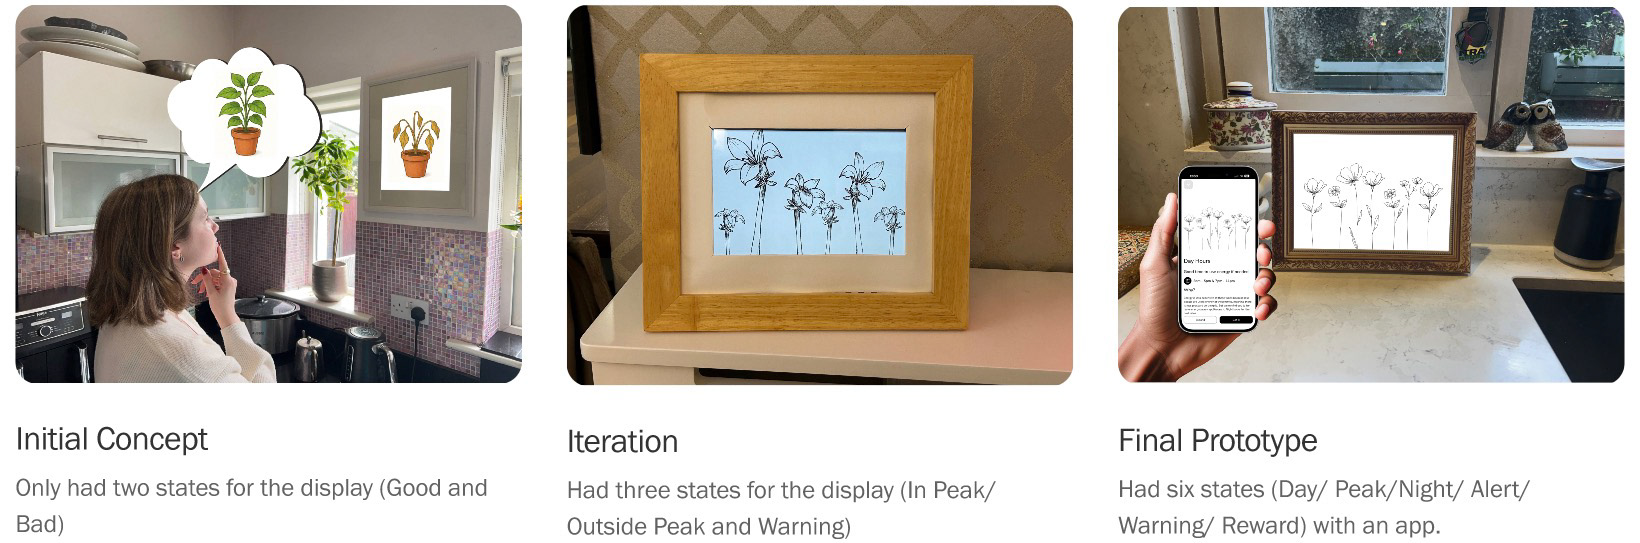
Sketches
Making
I made the display images and animations on Adobe Animate.
I made the frame using a laser cutter on Adobe Illustrator.
I used an iPad to act as the e-ink display.
App was made on Figma.
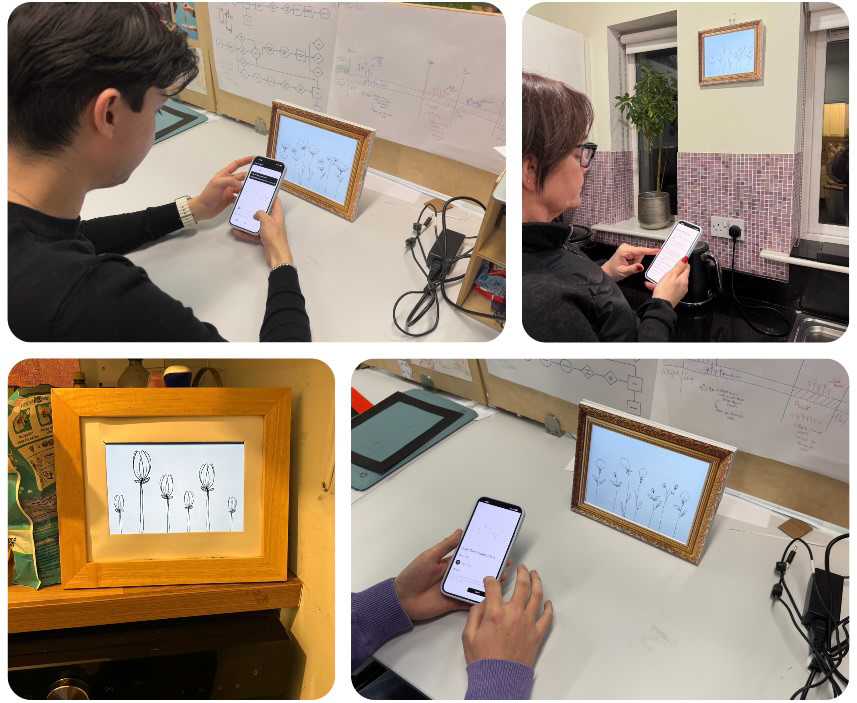
User Testing
Tested with 9 people, in homes and in studio with different iterations of the prototype. With an age range of sixteen to fifty five.
How Does it work?
Smart meter
Connecting your smart meter to your Energy Framers app and display.
Display
Display changes based on time of day and user behaviour.
kWh into cost
Tracks energy as cost rather than kWh for better understanding.
Video
Deliverables
How it gets its data
Choose your energy provider and smart meter plan, then connect via Bluetooth to start syncing your data.
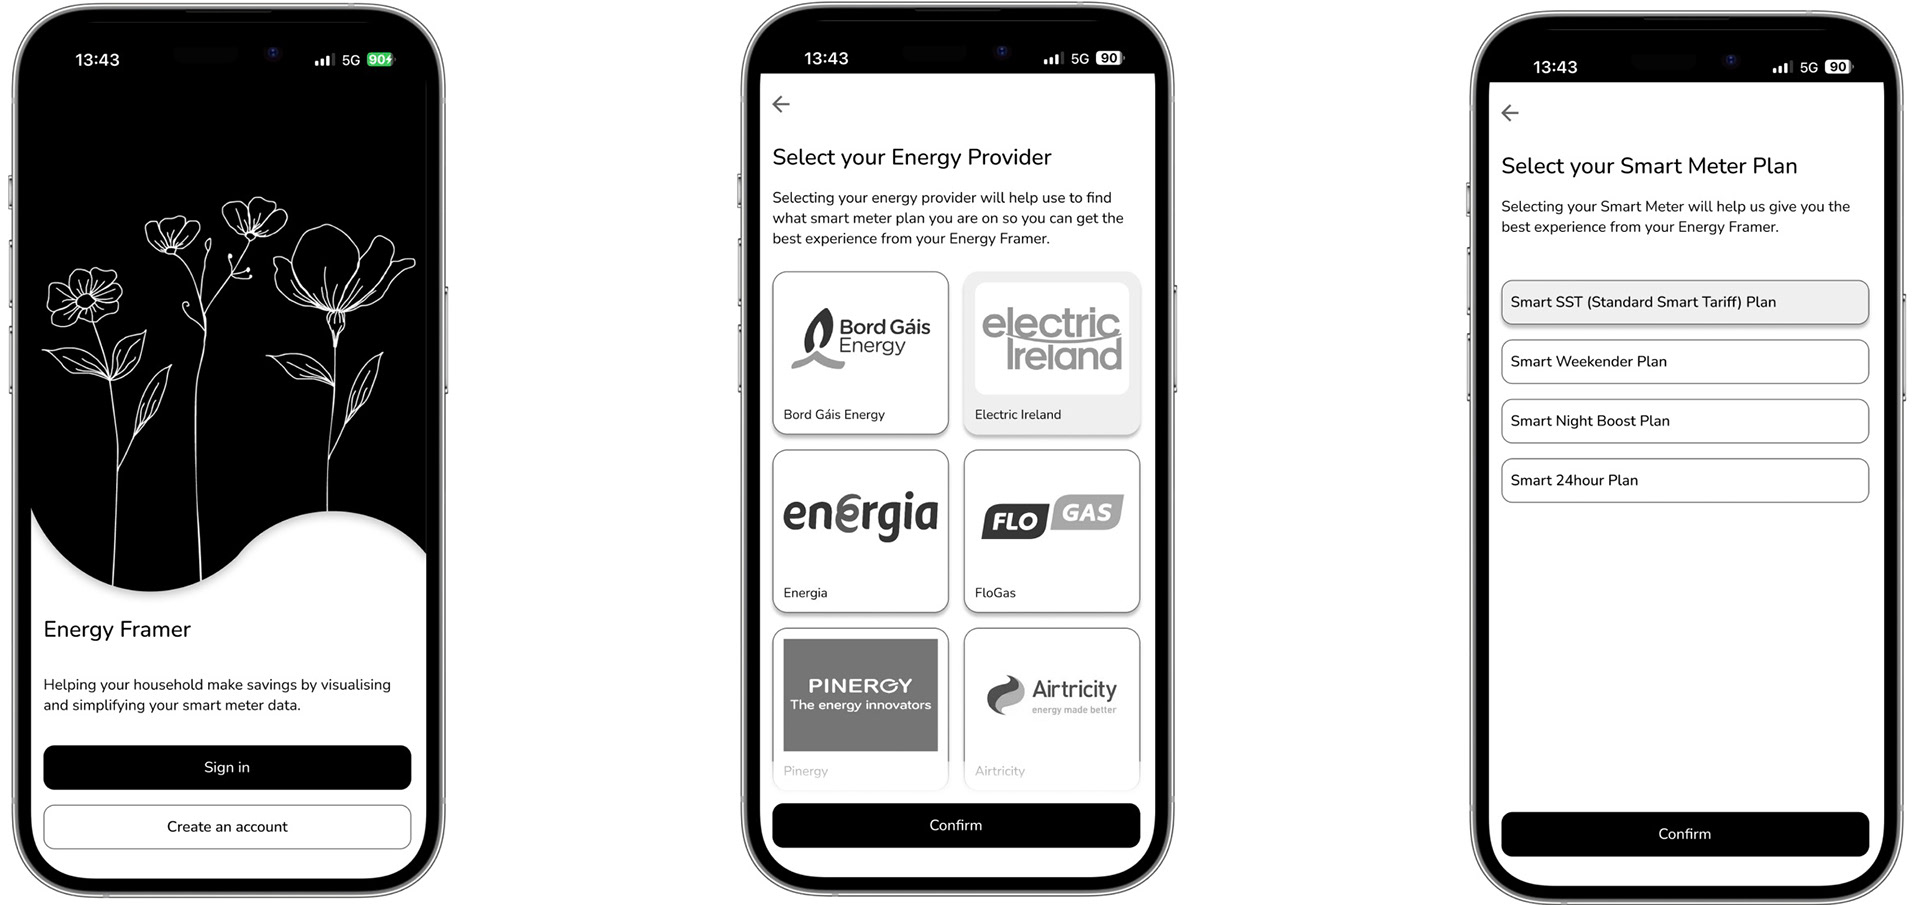
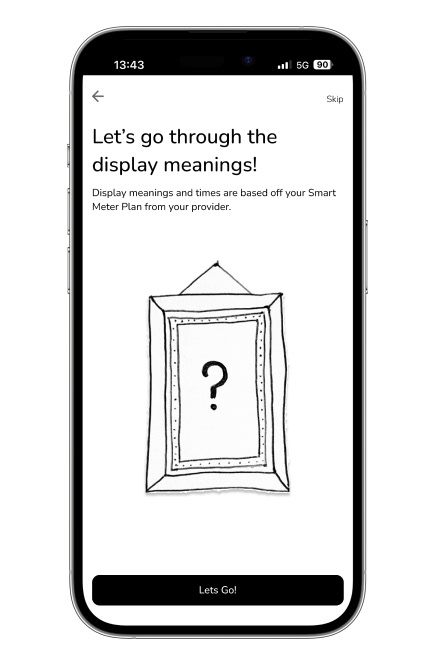
Onboarding
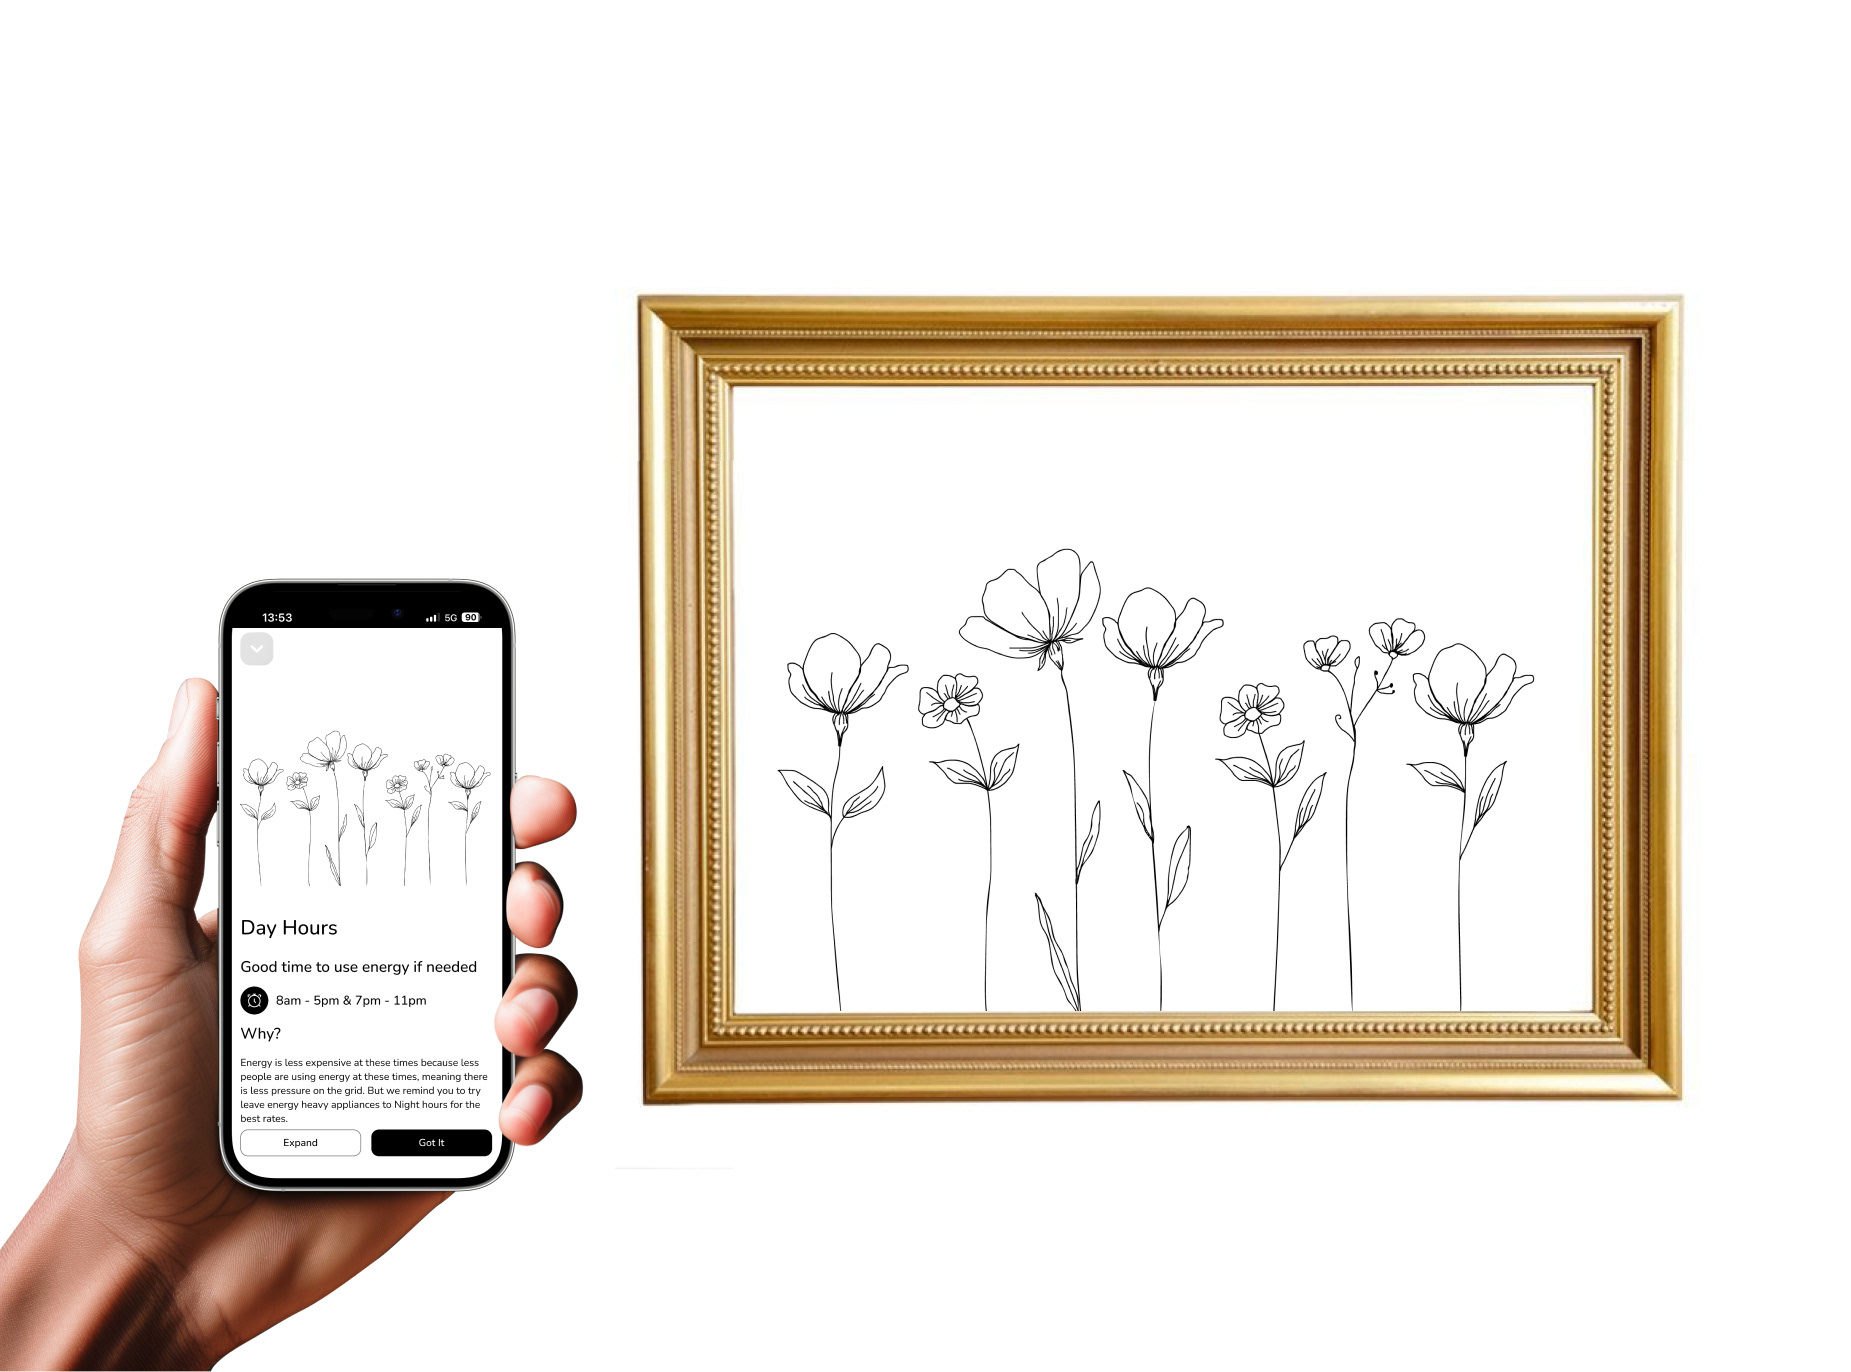
Day Hours
Shows when its a good time too use energy. Depending on your smart meter plan, typically 8am-5pm and 7pm-11pm.
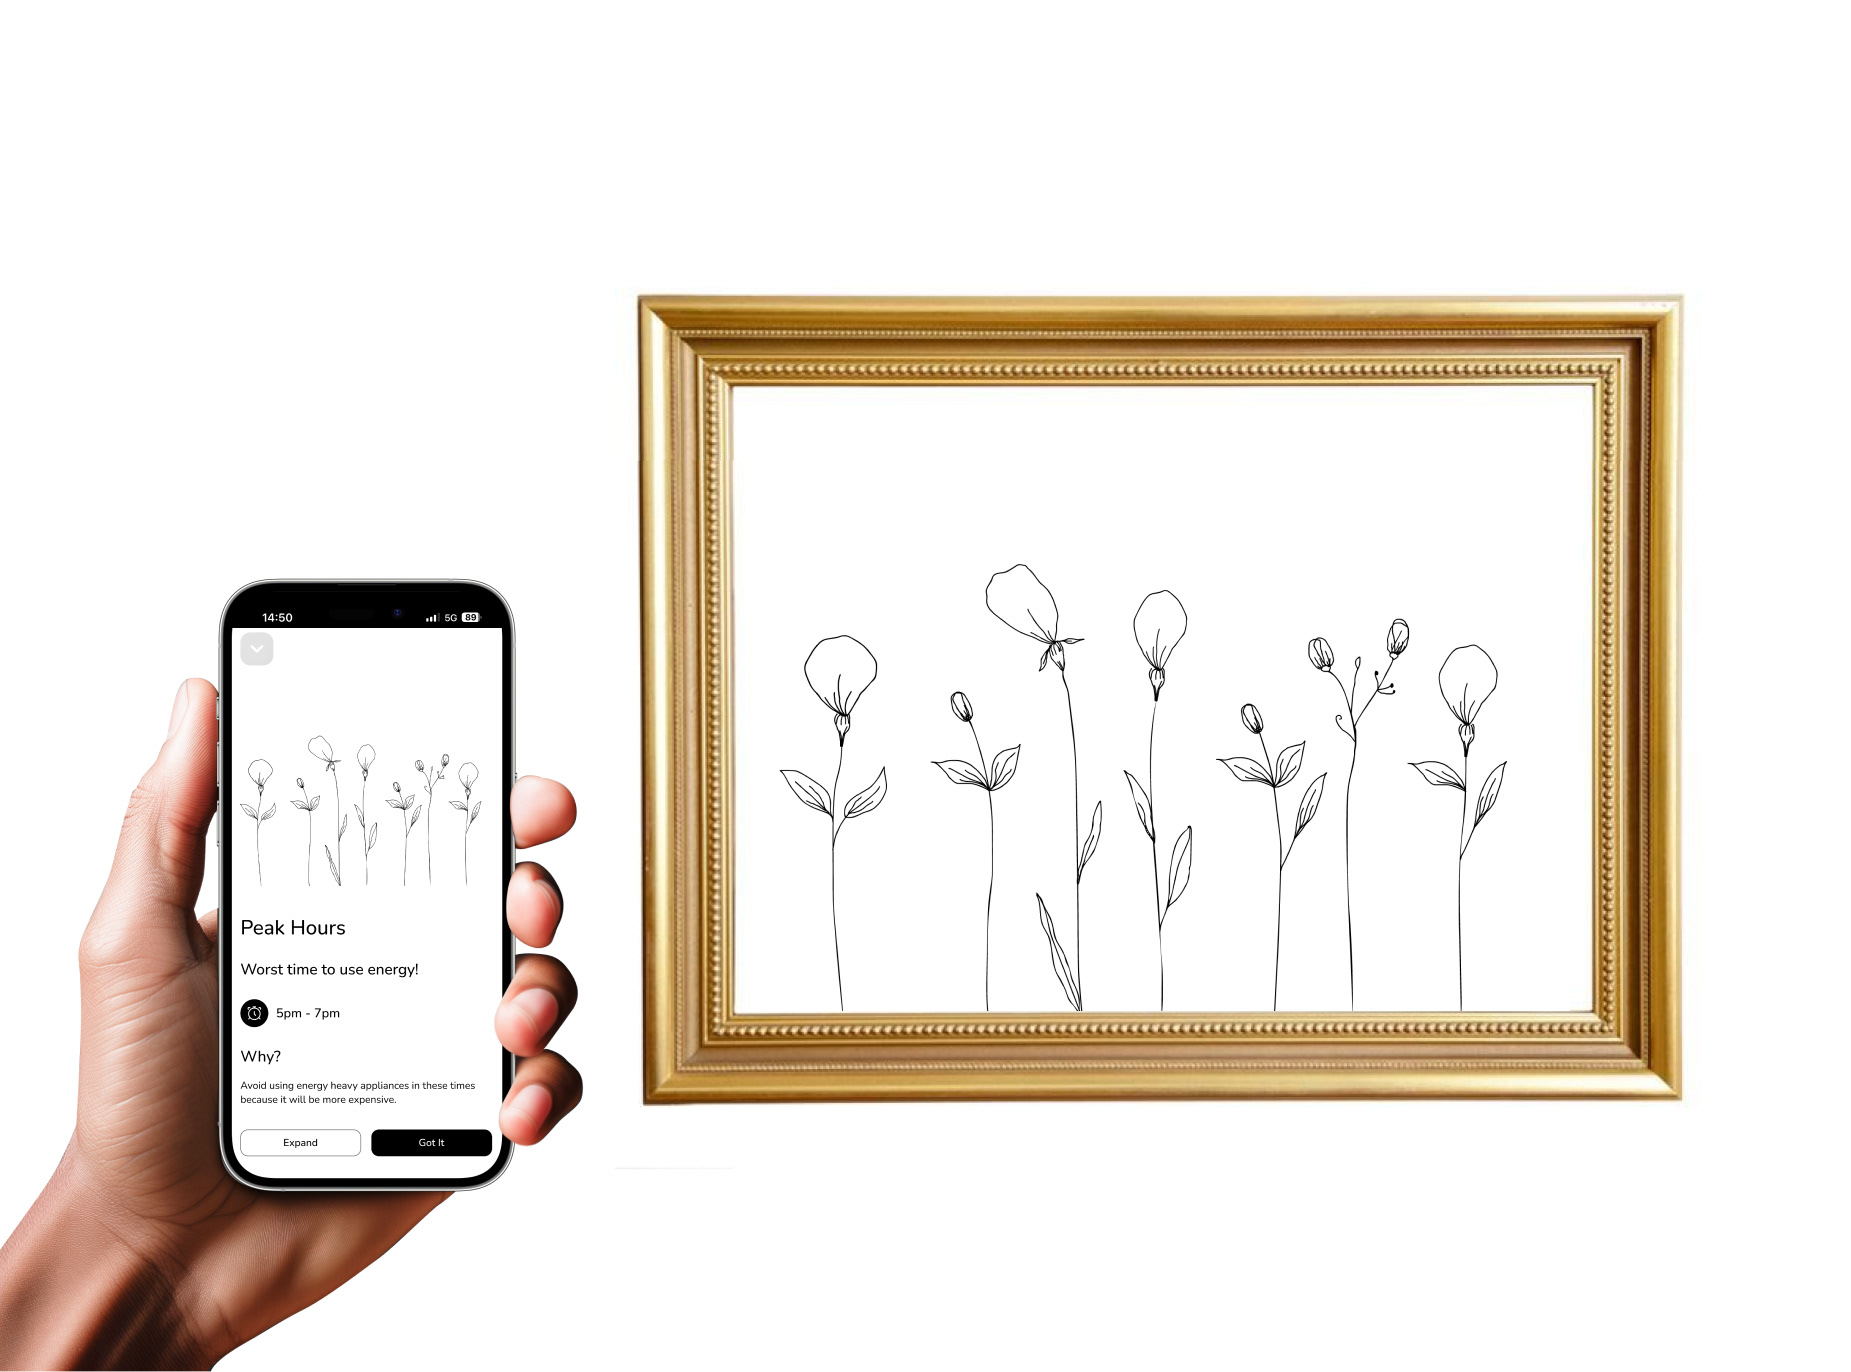
Peak Hours
Energy costs more during this time due to higher demand on the grid. Typically 5pm–7pm.
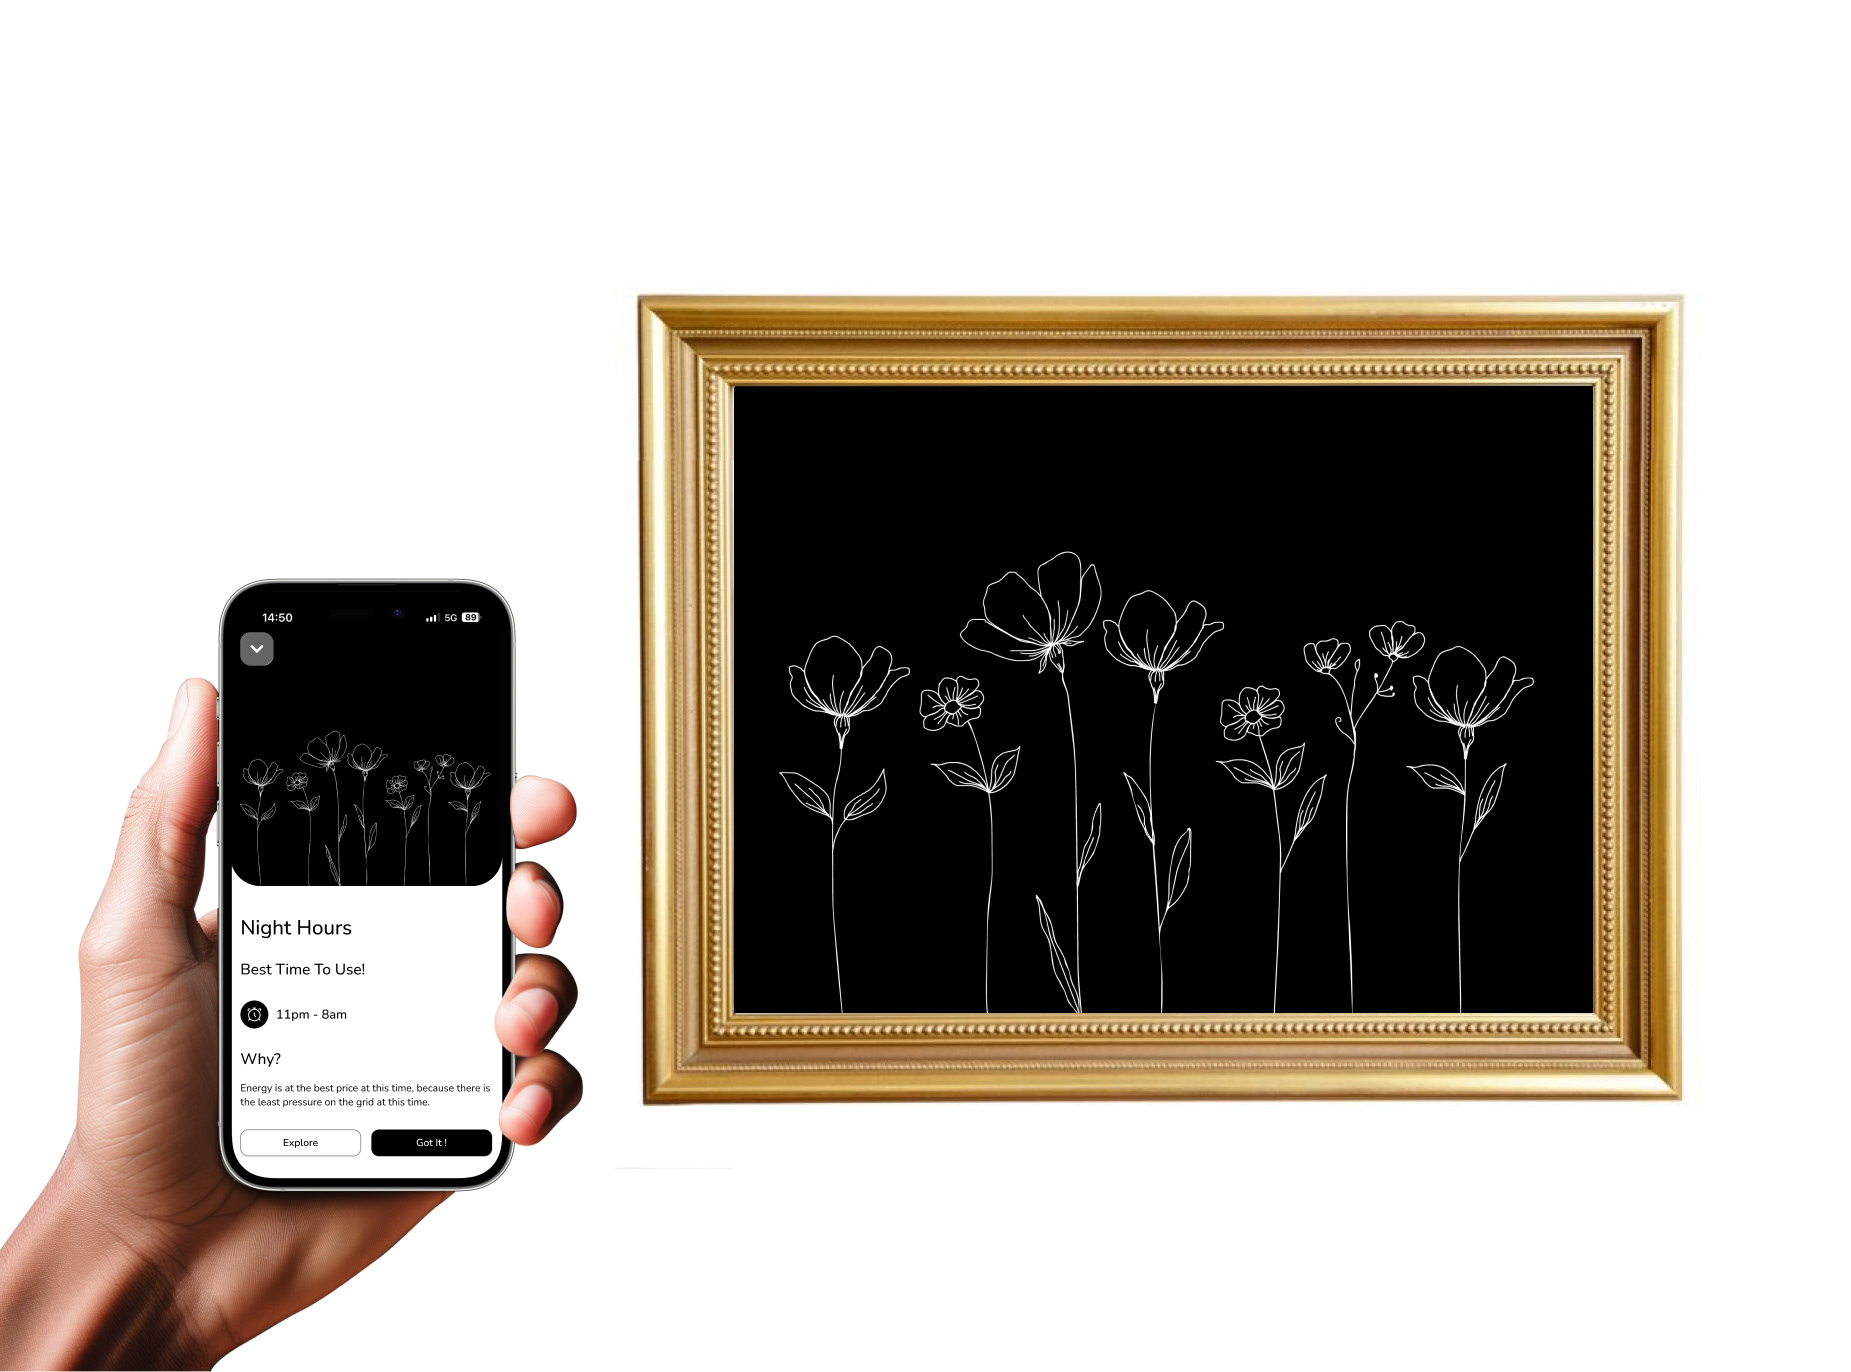
Night Hours
The best time to use energy. Ideal for running energy-heavy appliances. Typically 11pm–8am.
Doing good on Energy Shift
Lower your bills and earn visual rewards that show how your energy use is improving.

Connect:
Gmail: savagetara551@gmail.com